Open source / LinkedIn dashboard
Your LinkedIn dashboard
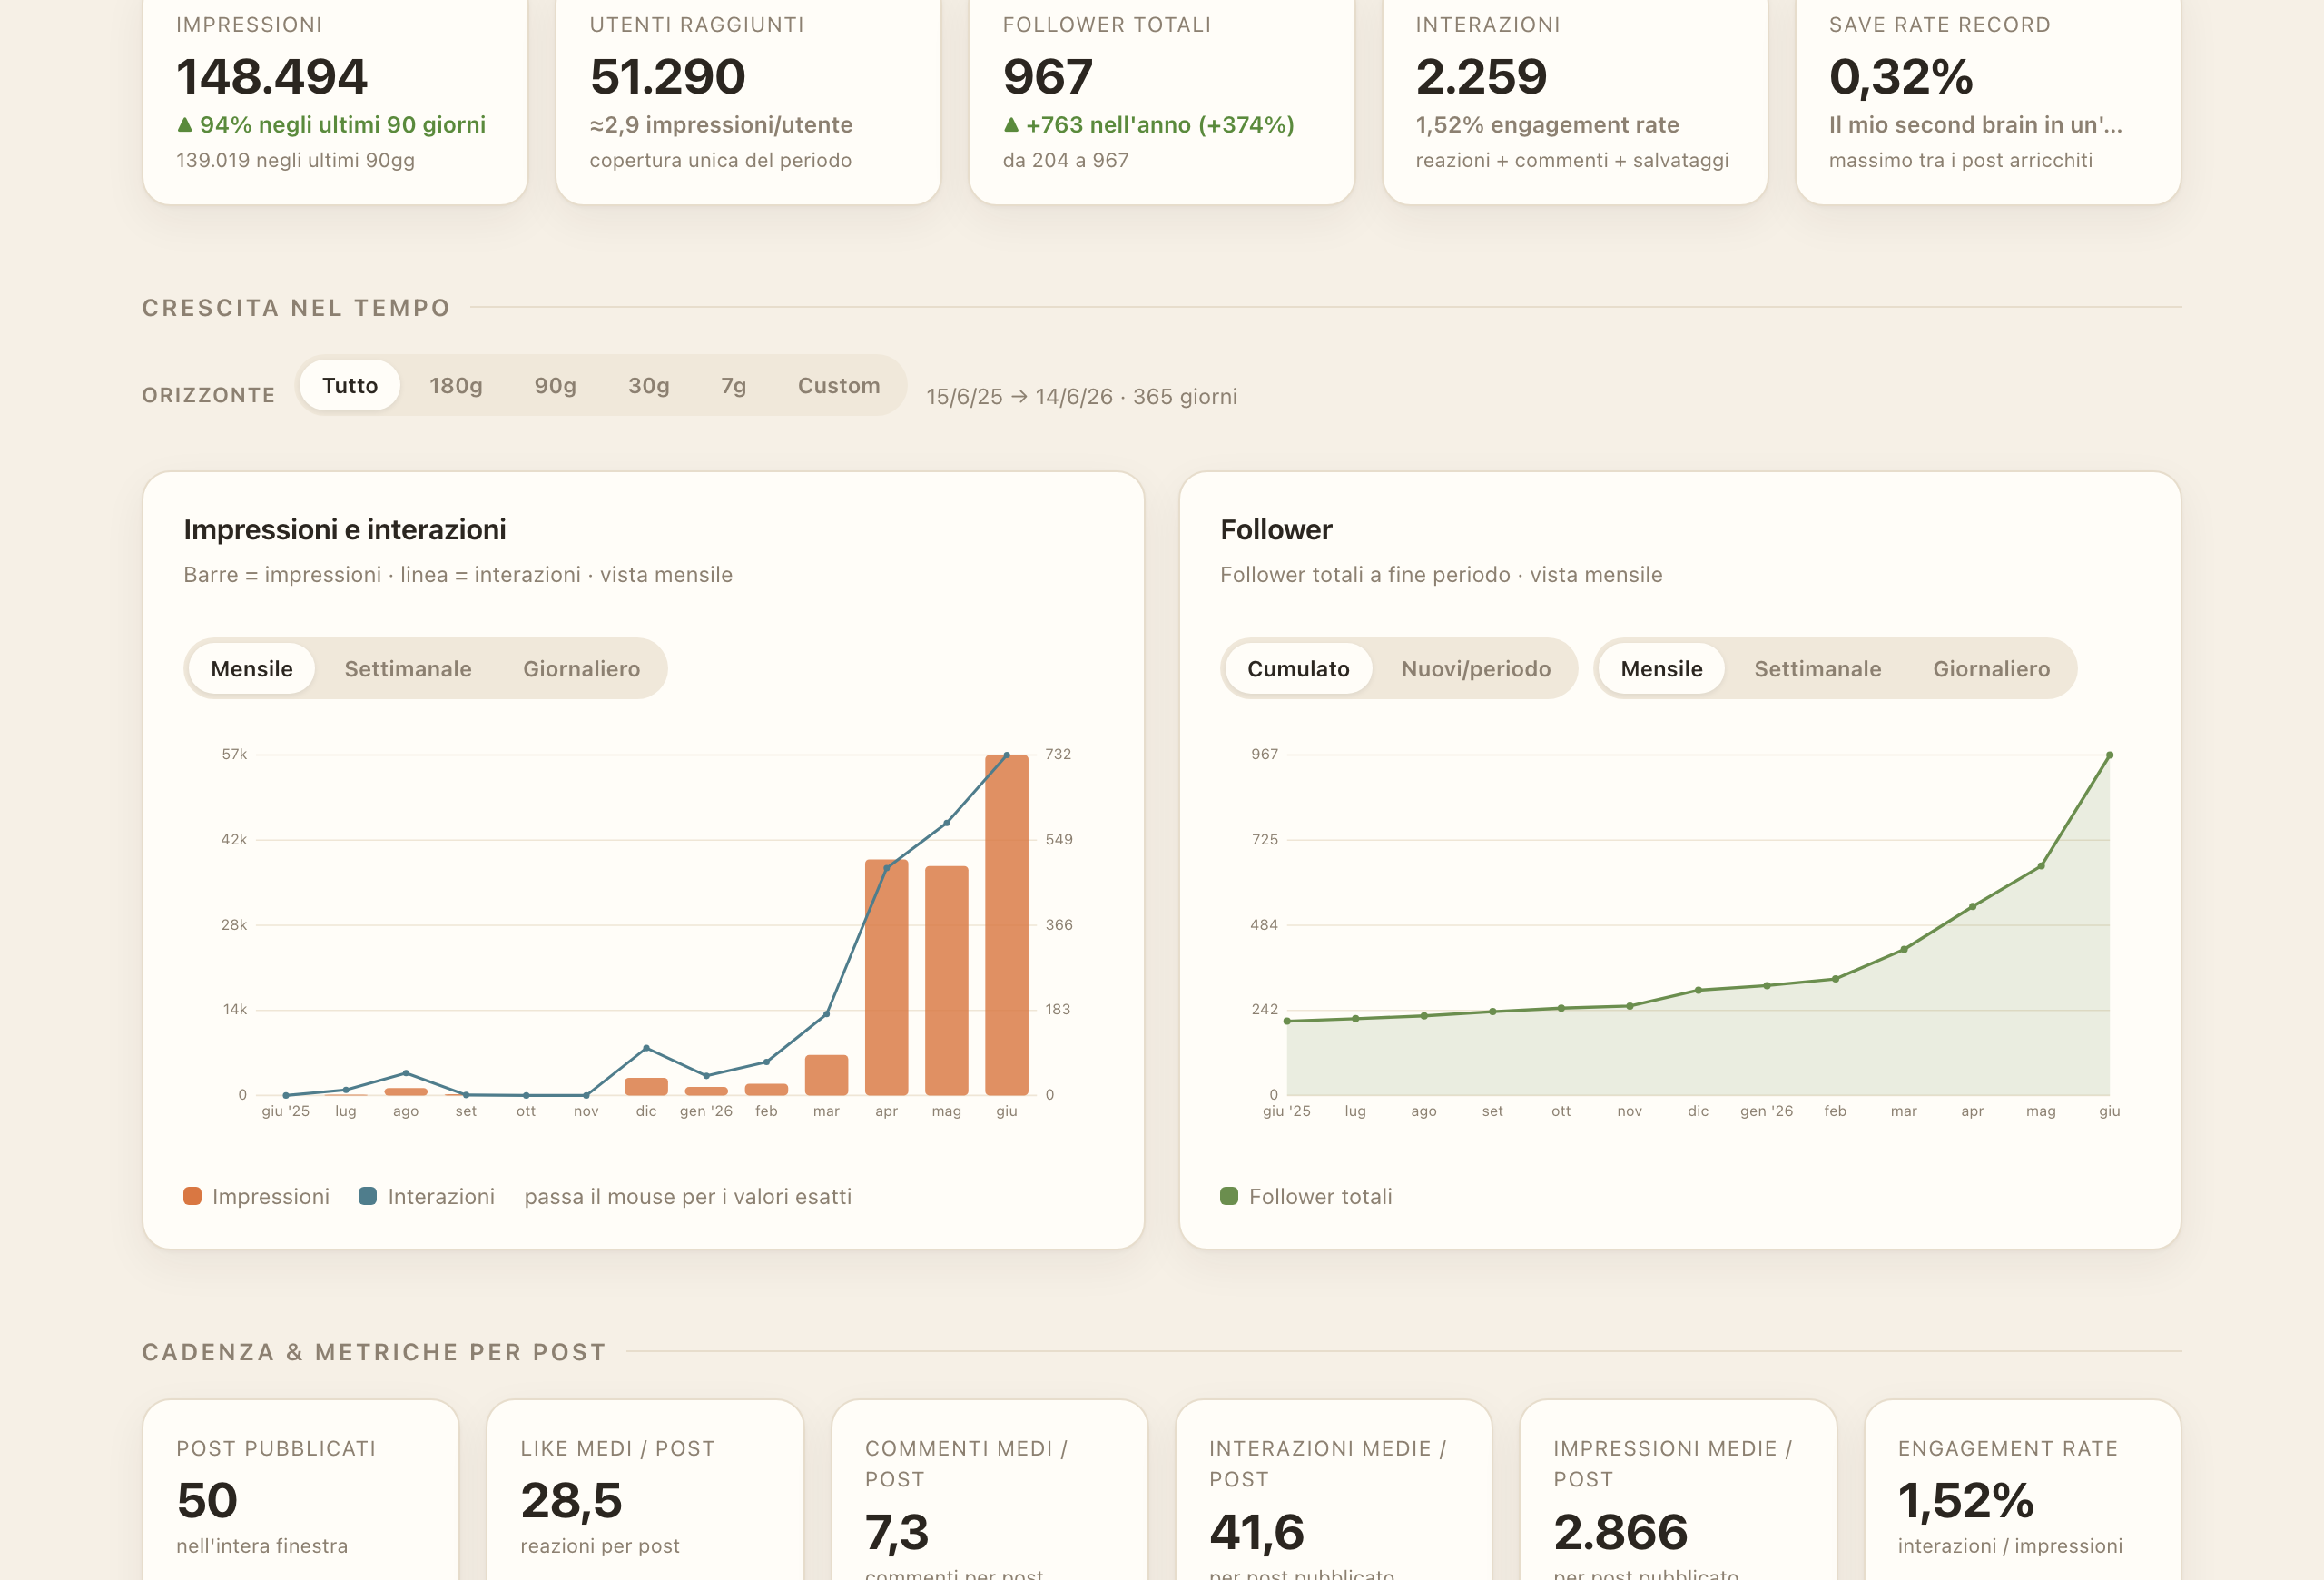
A dashboard in a single file, built with Claude. It combines LinkedIn’s official export with the qualitative data LinkedIn doesn’t give you: hooks, format, saves. No server, no subscriptions.
Free, MIT licensed. The demo below shows my real numbers from a year on LinkedIn.
What you get
Everything LinkedIn hides from you, on one page
KPIs and growth
Impressions, reach, interactions and followers up front. Growth over time with zoom and monthly, weekly or daily granularity.
Rankings and pillars
Your posts ranked, impressions by topic, reach against engagement. See what works and why.
The qualitative layer
Saves, profile visits, followers per post, hook, format, CTA: the data the export doesn’t have, plus your own take on what worked.
Demographics
Who actually follows you: location, seniority, company size, industry. Straight from the official export.
Full table
Every post, sortable and searchable. One view to dig into the numbers when you need the detail.
Offline and private
One HTML file. It opens in the browser, works without a connection, and your data never leaves your computer.
Make it yours
Two inputs, one script, a finished dashboard
The fastest way: paste this command to Claude, in Claude Code, Cowork or claude.ai with web access.
read https://marcogalluccio.com/claude-linkedin-dashboard/skill.md and help me create my LinkedIn dashboardClaude asks for your LinkedIn .xlsx export, explains how to get it, and gathers the qualitative data with you. Nothing to download by hand.
-
Claude Code
In the terminal, for developers or anyone who wants the full setup
Clone the repo, export your .xlsx from LinkedIn and put it in
Get the repo on GitHub →data/. Ask Claude to gather the qualitative data and runingest.py. Opendashboard.html. -
Cowork
Claude working on claude.ai, no terminal
Install the skill, upload the .xlsx you exported from LinkedIn and Claude builds the dashboard in the sandbox. Download the finished file and open it.
Download the skill (zip) →
Prefer a file to keep? The PDF guide (in Italian).
Example
See a real dashboard
The demo is my real dashboard, with a year of LinkedIn data: open it, sort the table, try zooming into the charts.
Want this for your team?
I teach teams to work with AI agents, in-company or in class in Rome. We start from tools like this one.